Agentic AI Consulting & Development

A conversational AI agent service powered by LangGraph and GraphRAG that analyzes large-scale water distribution network data through natural-language queries and detects anomalies.
Autonomous Intelligent Analysis
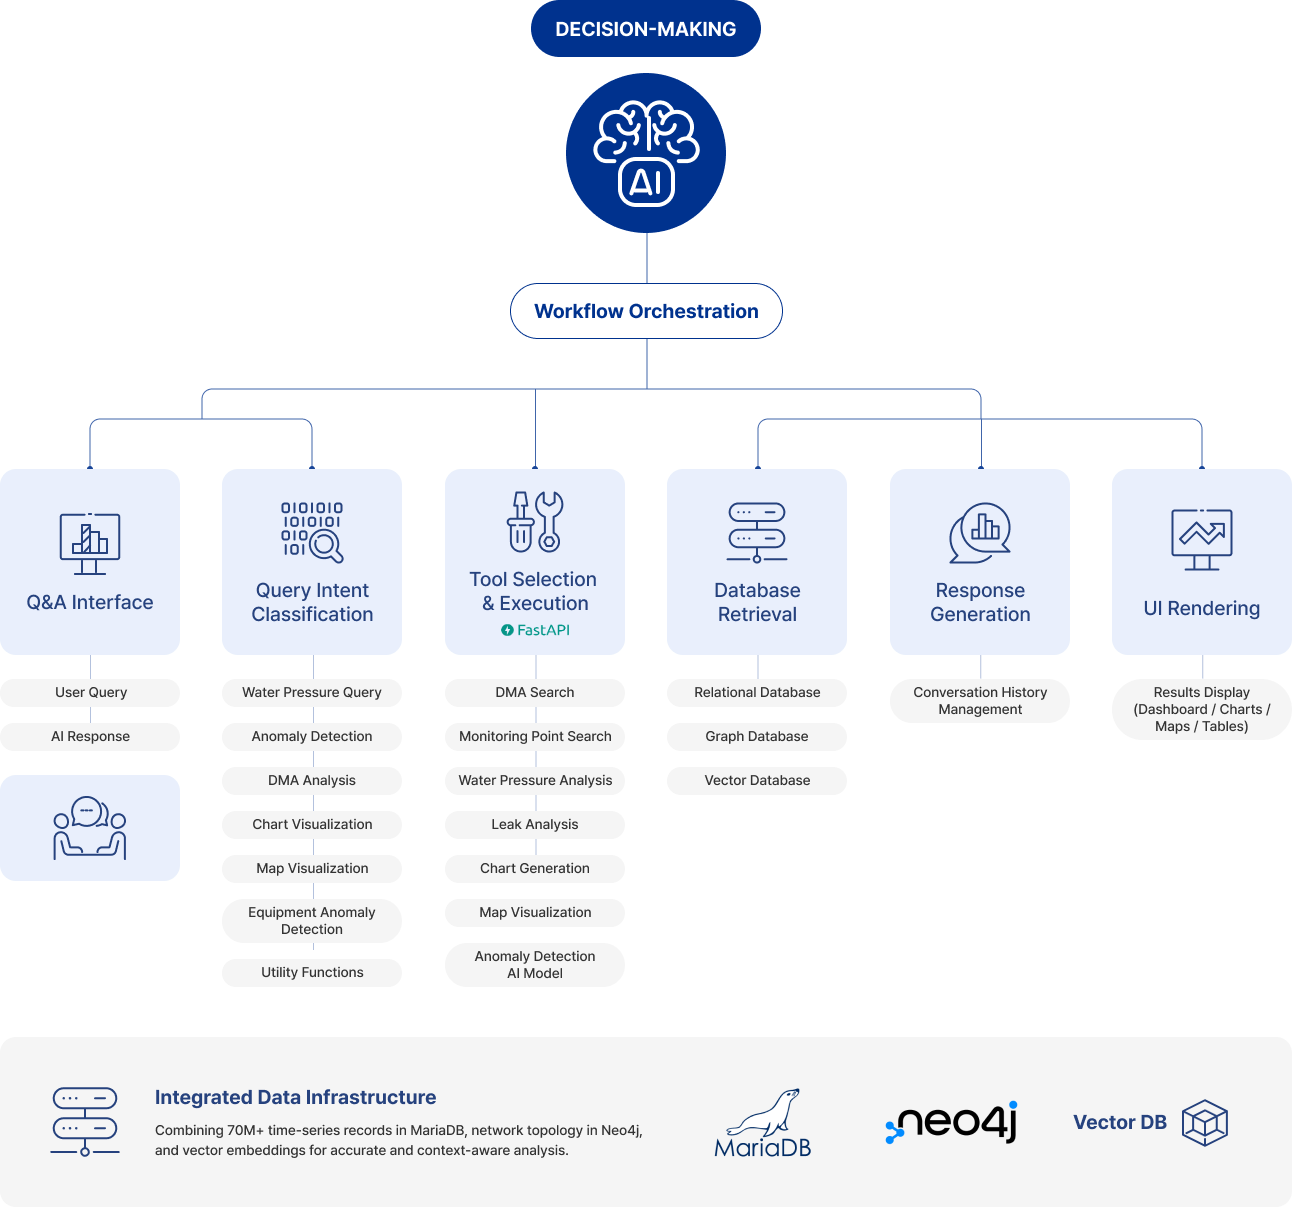
Based on each user query, the AI autonomously selects from 13 specialized tools to analyze time-series and graph data
Integrated Data Architecture
Combines more than 70 million time-series records in MariaDB with complex network structures in Neo4j for connected, context-aware analysis
Semantic Mapping
Vector embeddings map everyday language to precise locations within the water network and identify similar or related asset names
Continuously Updated Data
Automated daily ETL processes synchronize source data and regenerate vector embeddings whenever changes are detected


Service
Service Features
01
Conversational Network Analysis
Automatically explores network graphs and analyzes time-series trends using natural-language queries
02
Specialized Analysis Tools
Provides Minimum Night Pressure (MNP) trend analysis, block-level performance analysis, and anomaly detection
03
Autonomous Workflow Orchestration
The AI agent handles the entire process—from understanding user intent and selecting tools to retrieving data, performing calculations, and generating results
04
Intelligent Visual Reporting
Instantly presents analysis results as map-based heatmaps, MNP charts, block comparison charts, and concise summaries
05
Complex Relationship Querying
Handles relationship-based queries such as, “Show the pressure trends for all monitoring points within a specific block.”
Features
Key Service Benefits


Architecture
System Architecture