Optimizing Water Distribution Network Analysis with GIS & Hydraulic Simulation
Efficient leak management is crucial for maintaining water distribution systems, and tools like Geographic Information Systems (GIS) and hydraulic simulation software such as EPANET can greatly improve this process.
By analyzing different factors related to leakage likelihood, these technologies help prioritize areas at higher risk of leaks. This article examines how GIS and hydraulic modeling can be applied to a water distribution network in Indonesia.
We will explore key factors like pipe condition, pressure variations, and flow velocity, and demonstrate how these insights can be used to create a decision matrix for effective leak detection and maintenance prioritization.
GIS in Water Distribution Network Analysis for Leak Detection
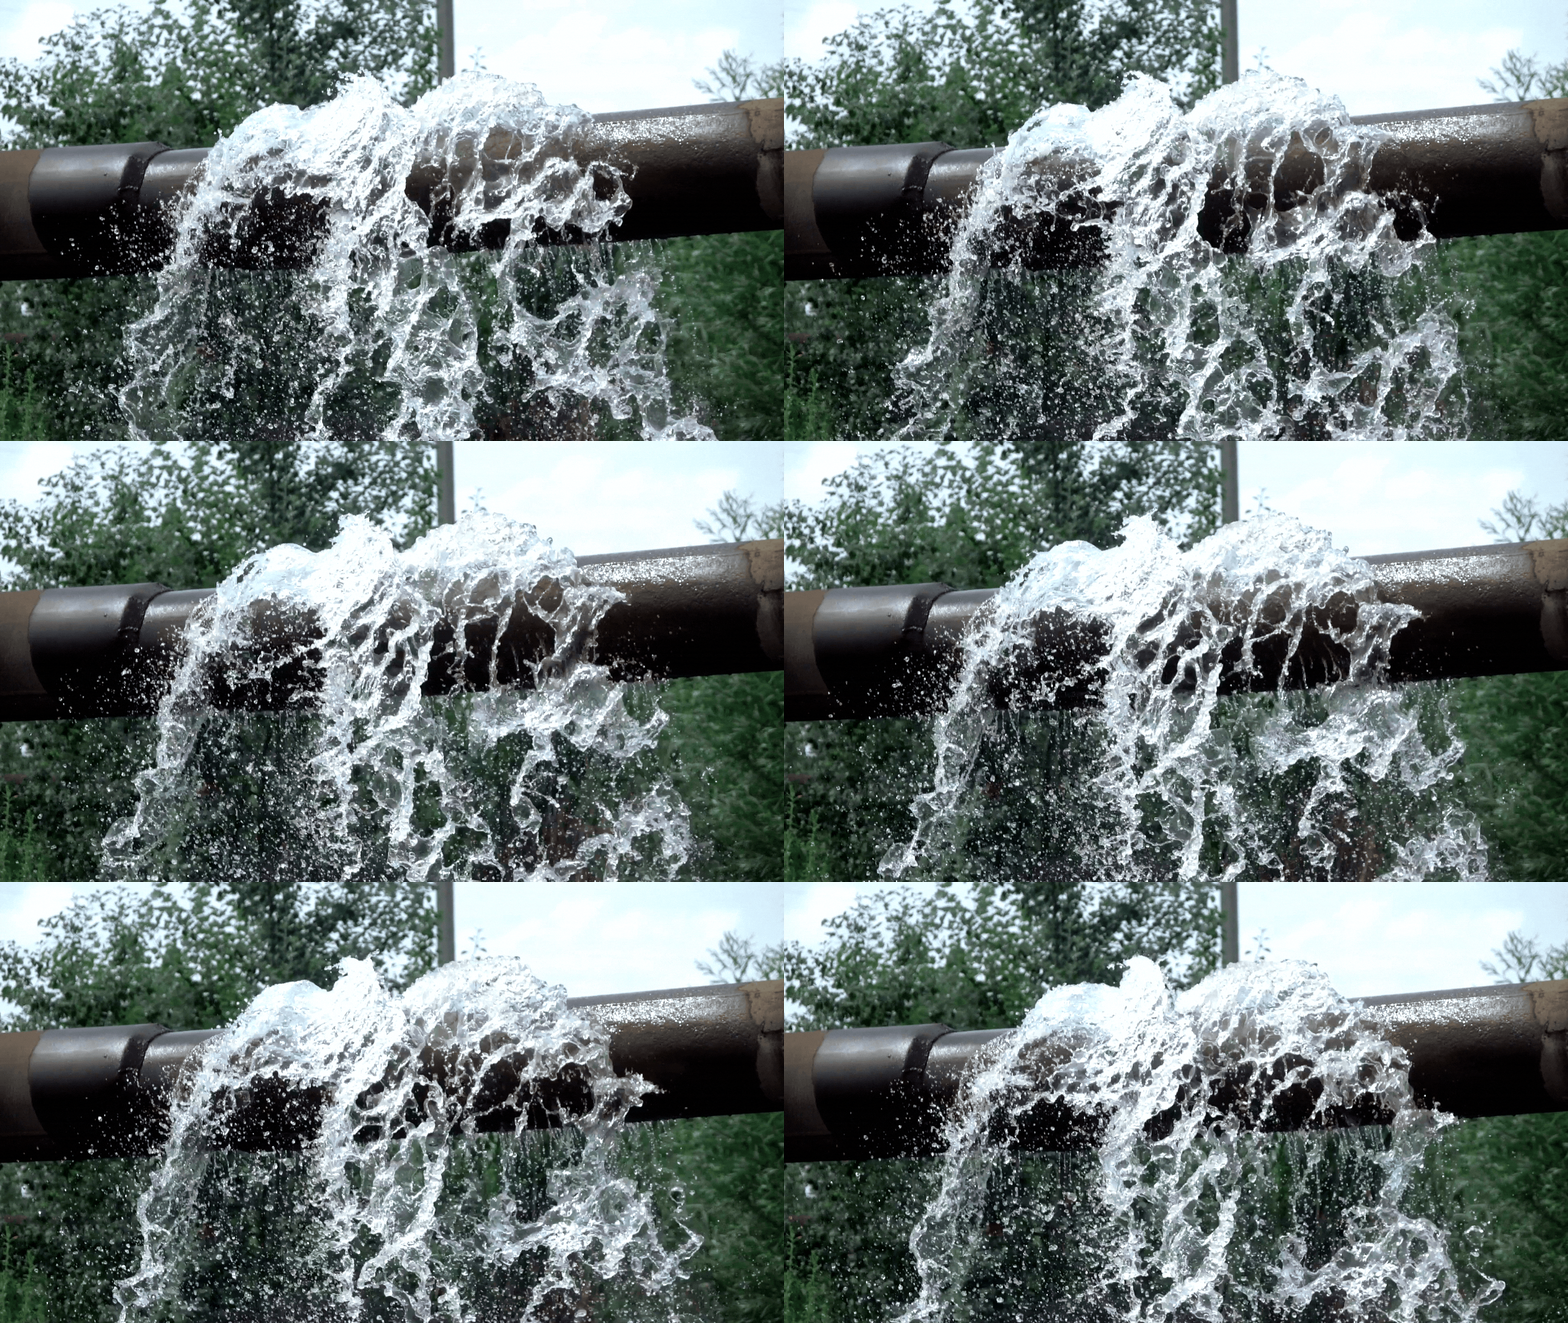
Geographic Information System (GIS) data plays a key role in identifying and prioritizing areas for leak detection. Incorporating insights from detecting water leaks can further enhance decision-making for water distribution systems.
By analyzing factors such as the age, material, and condition of pipes, GIS helps target sections most susceptible to leaks.
a. Role of Pipe Material in Water Distribution Systems
Older, metal-based pipes (e.g., cast iron, galvanized steel, and steel) are particularly prone to corrosion and degradation, posing significant challenges in water distribution systems.
The corrosive effects of water, soil conditions, and exposure to oxygen can cause these metals to weaken, develop rust, and lose their structural integrity.
As the pipes corrode, they become more susceptible to cracks, punctures, and joint failures, which can lead to water leaks.

Figure 1: Pipe material repartition map and bar chart
In the example above, some of the main pipes are made of cast iron (CI) and galvanized steel (ST). Those pipes are more prone to corrosion compared to PVC, HDPE, and asbestos cement (AC) pipes.
However, asbestos cement (AC) pipes are more vulnerable to cracking and breaking over time, particularly due to their brittle nature as they age, rather than corrosion.
b. Pipe date of installation
The age of a pipe and the year it was installed are critical factors in assessing the likelihood of leaks.
Over time, the materials used in plumbing systems naturally degrade due to a variety of environmental factors, such as temperature fluctuations, soil movement, and the constant wear from continuous use.
As pipes age, they face growing stress from these external elements, which can lead to the deterioration of the pipes’ structure. This stress can cause cracks, weakened joints, and, eventually, leaks.

Figure 2: Pipe date of installation map
In the example above, the pipes marked in red are over 40 years old, making them significantly more vulnerable to failures and water leaks.
The advanced age of these pipes means they have been exposed to decades of environmental changes and stress, which, combined with the aging of the materials, greatly increases the risk of cracks, bursts, and other forms of leakage.
c. Impact of Topography on Water Distribution Network Analysis
The topography of the area plays a crucial role in identifying regions that are more prone to leaks.
Specifically, parts of the network situated at lower elevations, relative to the inlet point, are more likely to experience higher pressure, which can increase the risk of pipe bursts.

Figure 3: Digital Elevation Model (DEM) and junction elevation maps
In the example above, the southeastern part of the network is more prone to leaks due to its proximity to the inlet and its lower elevation. This combination of factors results in higher pressure in this area, making it more susceptible to pipe bursts and leaks.
d. Water demand repartition
The distribution of water demand across the network plays a significant role in identifying areas more vulnerable to leaks and failures. Regions with higher water demand often experience increased pressure fluctuations, which can strain the system and elevate the risk of pipe bursts.
In contrast, areas with lower demand may see reduced flow, leading to stagnation and potential blockages.

Figure 4: Base water demand repartition heatmap and diagram
In the example above, eastern and northern areas of the network with higher water demand are more susceptible to leaks due to the constant pressure exerted by the flow requirements. This heightened pressure, especially during peak demand periods, can weaken the pipes and increase the likelihood of bursts or other failures.
Hydraulic Simulation in Water Distribution Systems for Leak Detection
Hydraulic modeling plays a vital role in identifying areas within a network that are more susceptible to leaks. Tools like water leak detection equipment enable accurate identification and prioritization of leak-prone areas.
By simulating the behavior of fluid within the system under different conditions, hydraulic models can help prioritize locations where leaks are most likely to occur, or where they may have the most significant impact if left undetected.
The following simulated results are essential in hydraulic modeling simulations to identify these priority areas.
a. Analyzing Junction Pressure in Water Distribution Systems
Junction pressure refers to the pressure at specific connection points in the pipeline network, where water or other fluids are delivered to various sections of the system. Monitoring junction pressures is crucial because fluctuations in pressure can indicate potential leak points.
For example, unusually low pressure might suggest that there is a loss of flow due to a leak, while high pressure could stress the system, potentially leading to bursts or other failures. By identifying areas with abnormal junction pressures, utilities can prioritize those locations for further investigation.
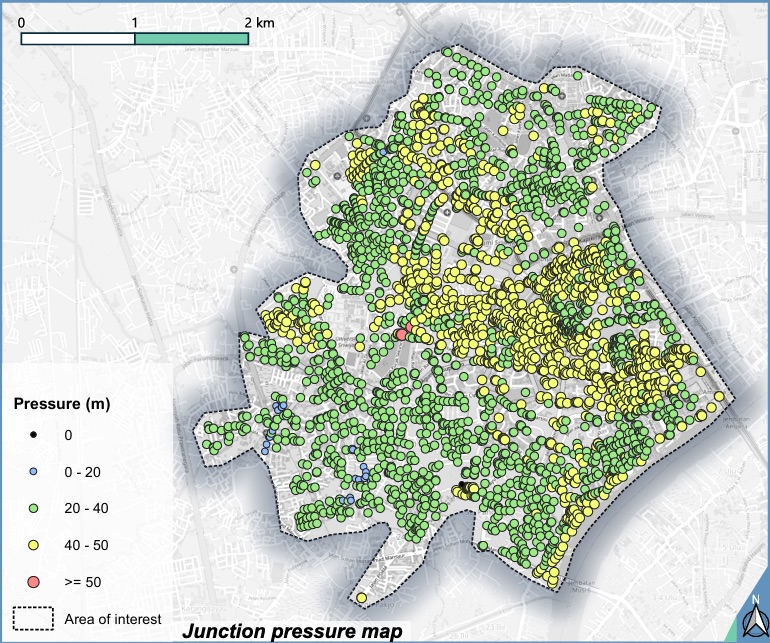

Figure 5: Junction pressure repartition map and diagrams
b. Pipe velocity
Pipe velocity refers to the speed at which fluid flows through the pipes. A high velocity can increase the likelihood of wear and tear on the pipes, which in turn raises the risk of leaks or bursts, especially in older infrastructure.
This highlights the importance of how to find underground water leaks for effective leak prevention and maintenance.
Hydraulic modeling can help simulate varying flow conditions and predict areas where velocity-related problems may lead to pipe damage. Prioritizing these areas based on velocity data allows for more targeted leak detection and maintenance activities.
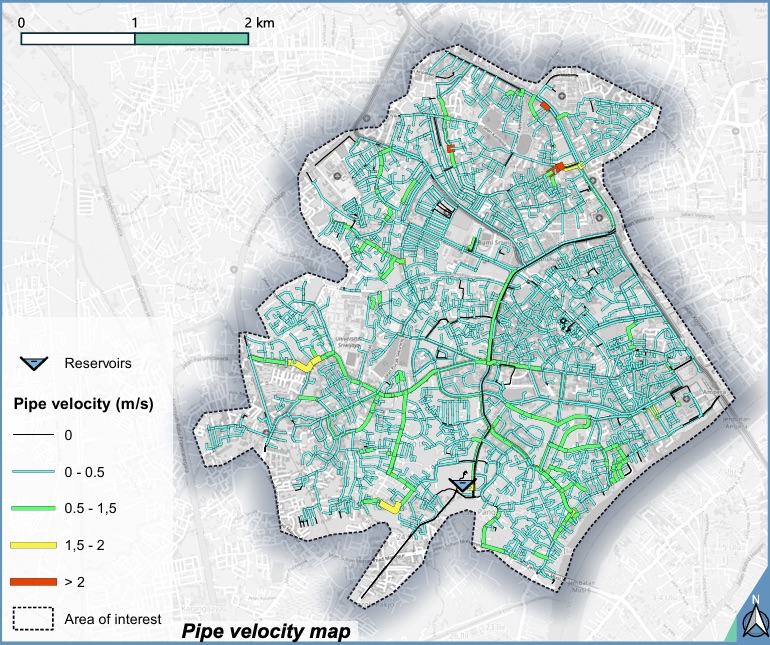
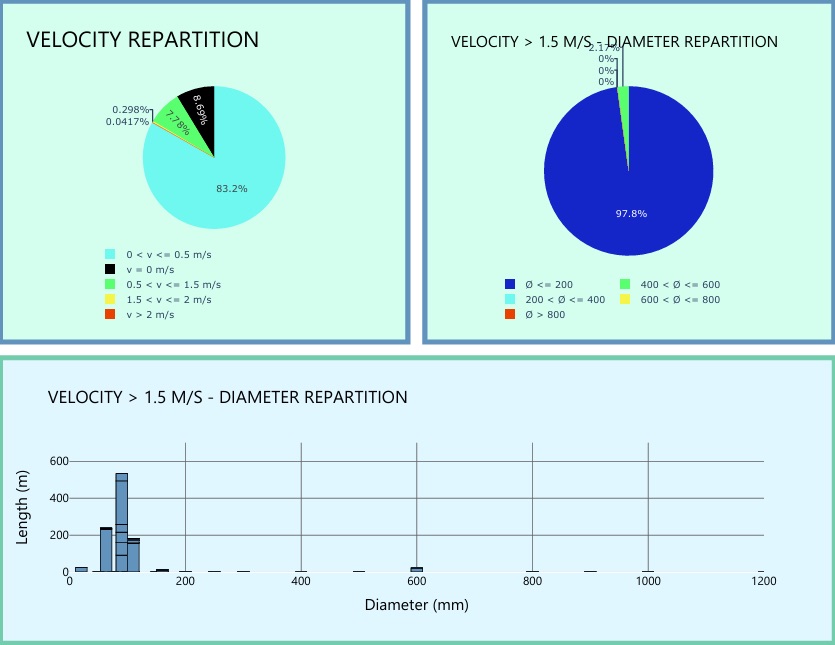
Figure 6: Pipe velocity repartition map, diagrams and bar chart
c. Understanding Pipe Unit Head Loss in Network Analysis
Pipe head loss refers to the reduction in pressure (or head) as fluid moves through a pipe, caused by friction and other resistive factors like bends, fittings, and the roughness of the pipe’s internal surface. Pipe unit head loss is the head loss per unit length of pipe.
Hydraulic modeling helps identify sections with excessive unit head loss, which can indicate potential leak sites. Areas with significant unit head loss become high-priority zones for maintenance and inspection to prevent further damage or system failure.
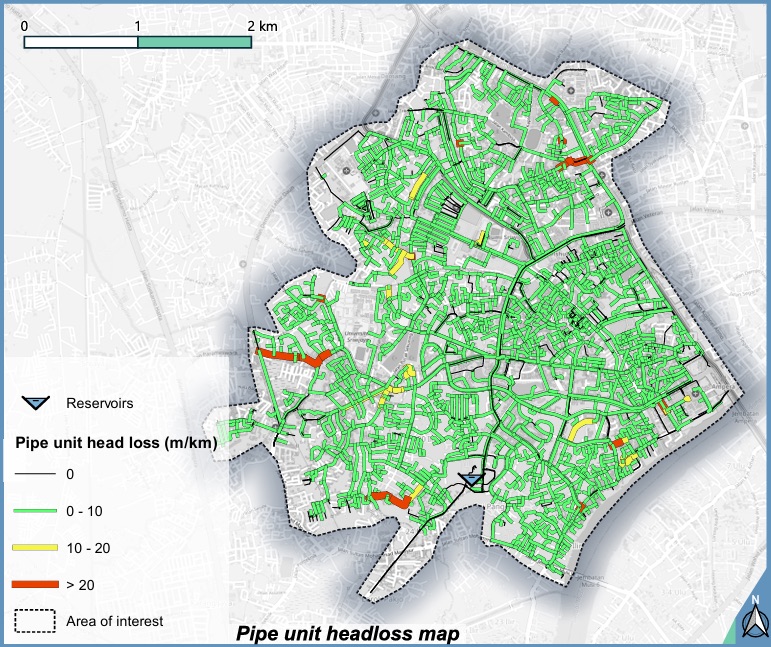
Figure 7: Pipe unit head loss repartition map
Decision Matrix for Water Distribution Network Analysis
Based on the analysis of GIS data and hydraulic simulation results, we can develop a decision matrix to identify and prioritize pipes that are most critical for leak detection. This matrix evaluates all key factors related to leak potential, on a score of 0 to 5, each then weighted by a coefficient that reflects its importance.

Table 1: Leak investigation matrix decision coefficient table
Each pipe is ultimately assigned a composite score between 0 and 100, with higher scores indicating greater urgency for leak investigation.
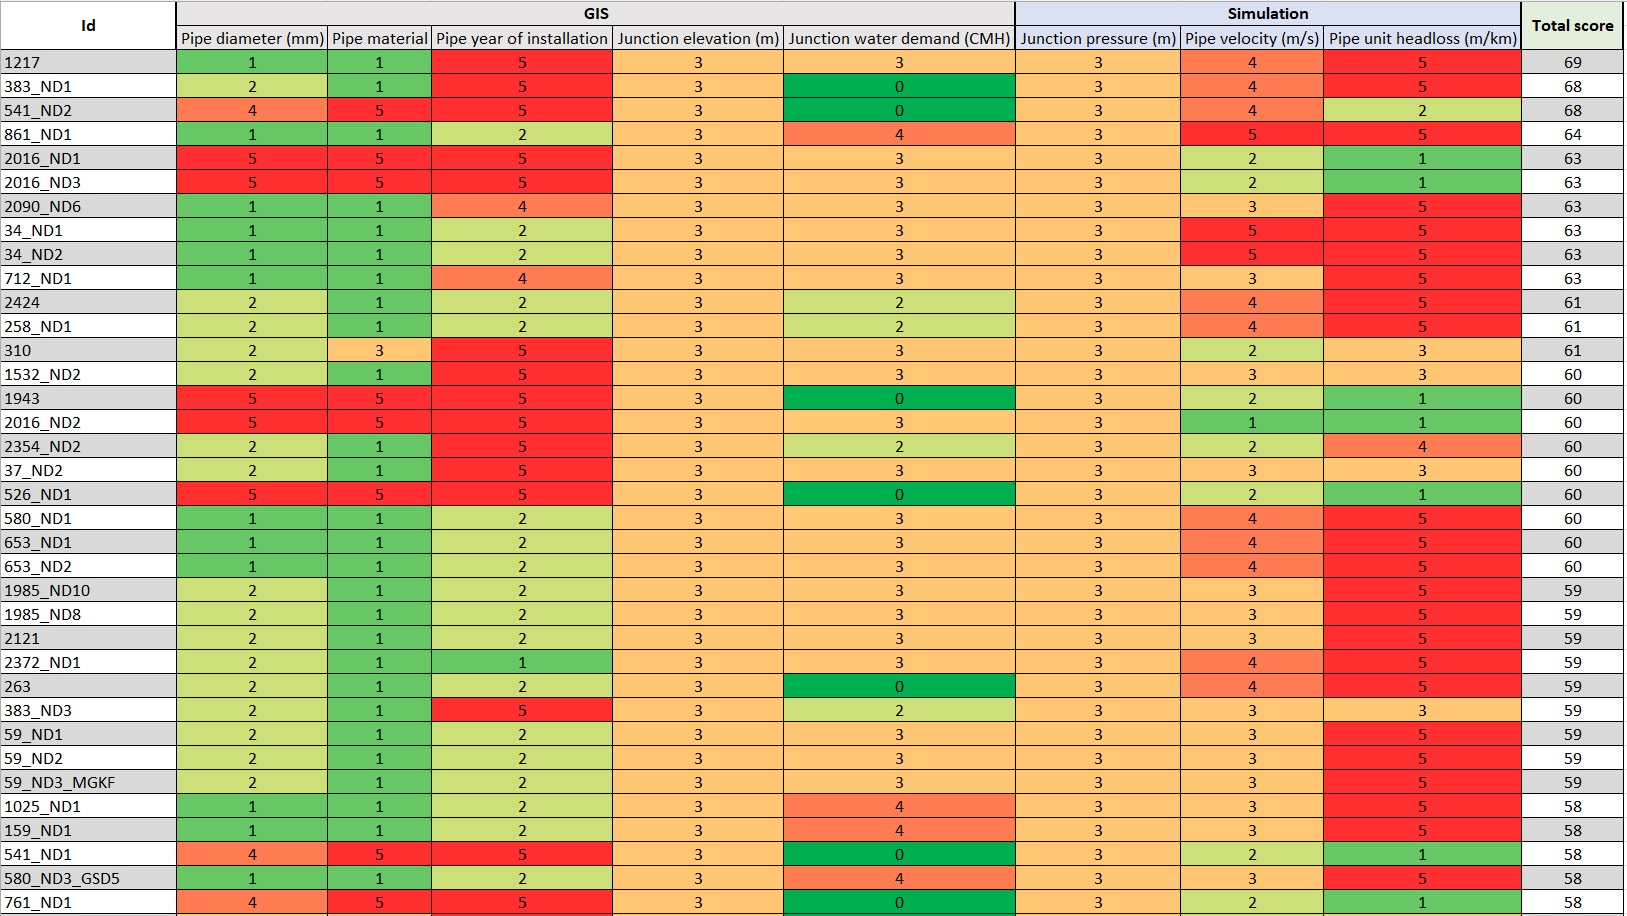
Table 2: Pipe leakage investigation score table
We can then map this data, allowing the local water authority to visually identify and prioritize the pipes and areas that require immediate attention for leak investigation.
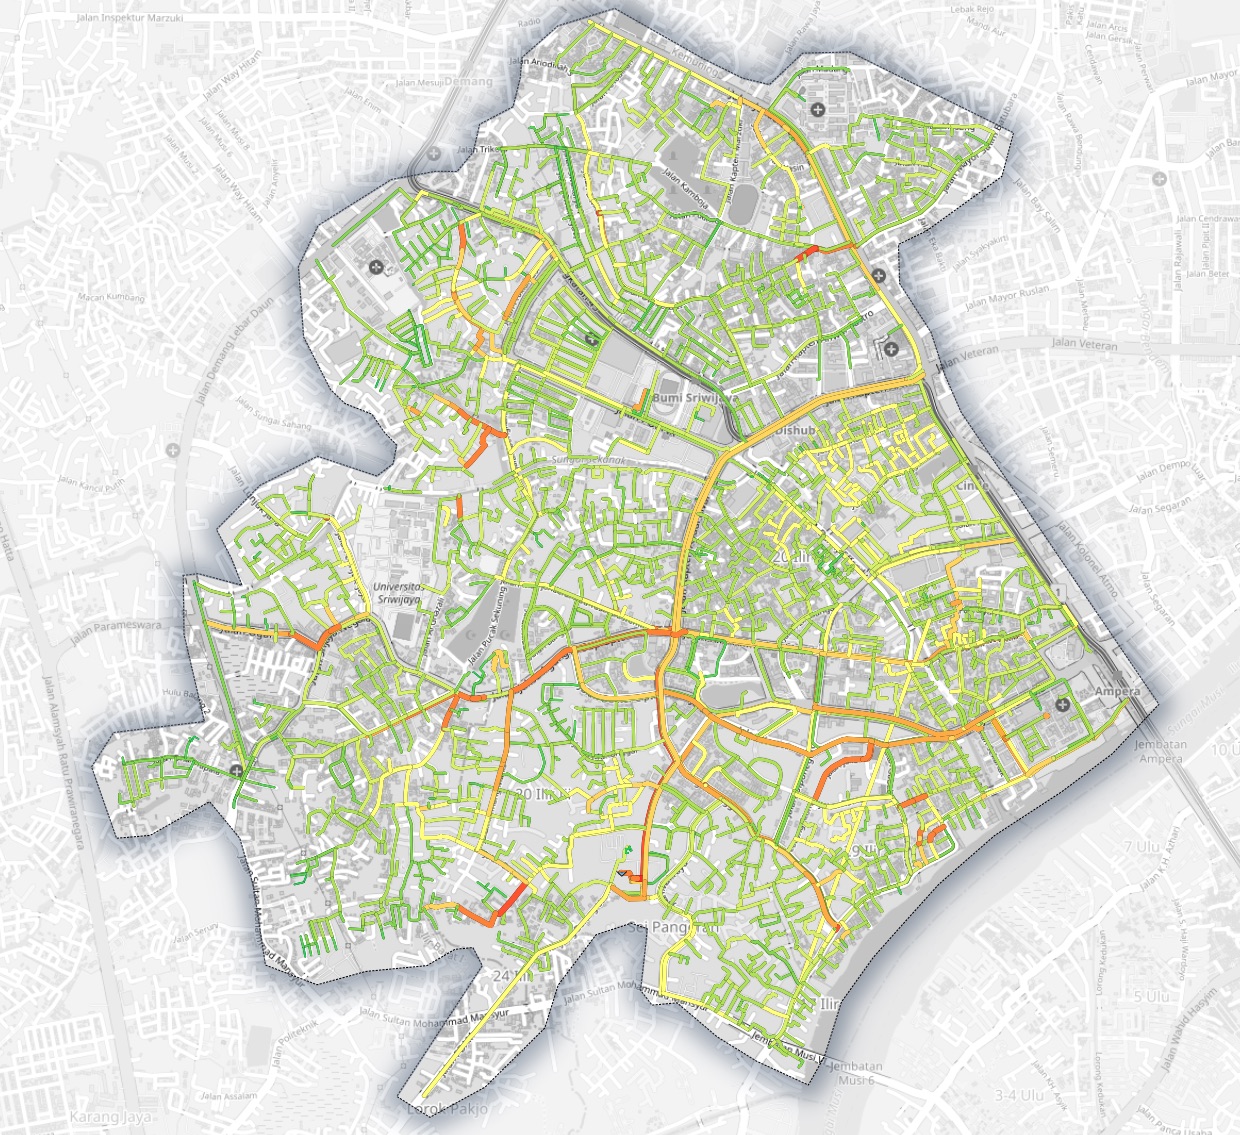
Figure 8: Pipe leakage investigation score map
In our example, the analysis shows that approximately 25% of pipes score above 40, while about 6% score above 50. These high-score pipes should be prioritized first for leak investigation.
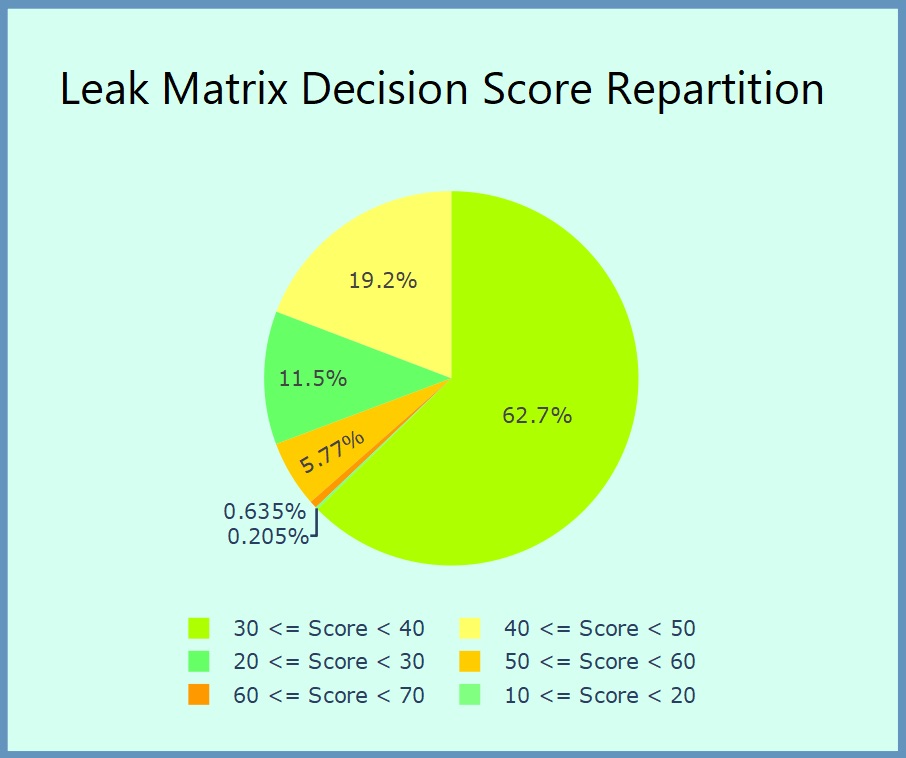
Figure 9: Pipe leakage investigation score repartition diagram
Conclusion
In conclusion, integrating Geographic Information Systems (GIS) and hydraulic simulation models significantly enhances the leak management process for water distribution systems. By leveraging GIS to assess critical factors such as pipe material, age, topography, and water demand, utilities can effectively identify and prioritize areas at higher risk of leaks. Hydraulic modeling further refines this process by simulating fluid behavior and detecting vulnerabilities based on junction pressure, pipe velocity, and head loss.
The decision matrix developed from these analyses provides a systematic approach to prioritizing leak detection and maintenance efforts. This comprehensive method ensures that resources are allocated efficiently, minimizing water loss, reducing maintenance costs, and enhancing the overall reliability of water distribution systems. Ultimately, this integrated approach can greatly improve leak detection, enabling more proactive and effective management of infrastructure, especially in regions with aging or vulnerable systems.


